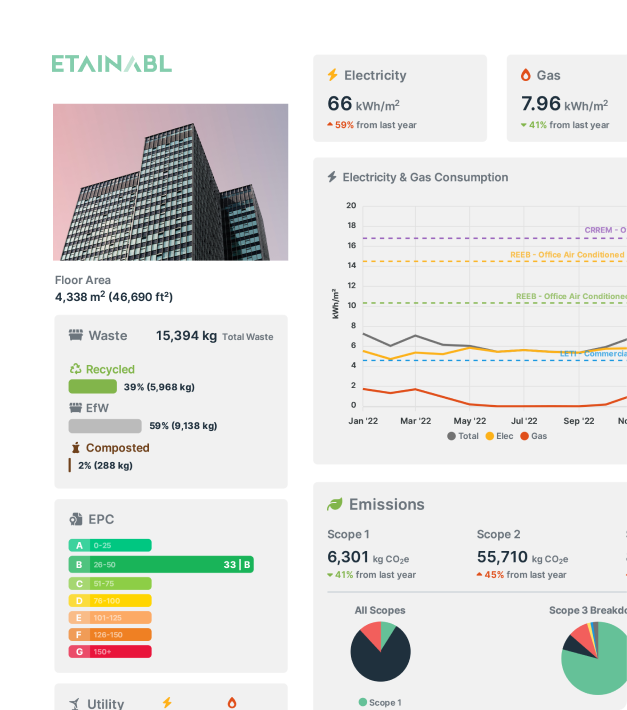














Half-hourly data arrives automatically from each meter and adds up to the monthly totals at the top.
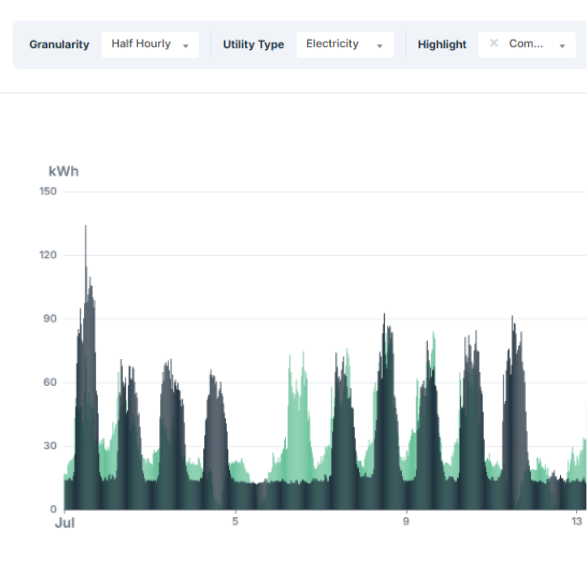
Every half hour of the month drawn as one line, so peaks, dips and patterns stand out.
Nights and weekends should be low. What still runs then is often the easiest saving to find.
Switch to bars and bring last August in behind, so every change is easy to see.

Every half hour of the year, darker where demand is higher. The working day is the band across the middle; weekends are the pale stripes.
In this example office, 38% of the electricity is used outside weekday working hours.
The overnight floor runs all year. Every kilowatt taken off it saves around 8,760 kWh a year.
Weekday against weekend, half hour by half hour, shows which plant and lighting run while the building is largely empty.